When you send a message to ChatGPT you start seeing its answer within a moment. Instead of waiting for the model to produce the full answer before displaying the output, the app prints out the tokens in sequence, giving you the feel of a real-time conversation. In this blog post we will look at how you can replicate this experience using the API by streaming the response. To follow along make sure you have signed up for an OpenAI API account and have installed the openai library that lets you use Python to make API calls (pip install openai).
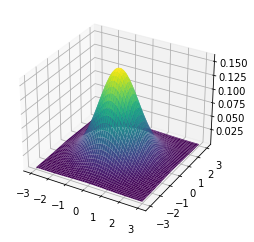
Let’s get started by asking ChatGPT to write a function to make a 3D plot of a 2D Gaussian distribution. It is not too difficult but the answer will be several lines in length. It is highly unlikely be generated almost instantly which makes it a suitable input to use for comparing the user experience with and without streaming.
Regular responses
When you make an API call to ChatGPT with stream set to False (the default option) you get back that looks something this:
<OpenAIObject chat.completion id=chatcmpl-7eijdlu4SYVIczkFfRVZMd7tZEURH at 0x108259ef0> JSON: {
  "choices": [
    {
      "finish_reason": "stop",
      "index": 0,
      "message": {
        "content": "Here's a Python function ...",
        "role": "assistant"
      }
    }
  ],
  "created": 1689939437,
  "id": "chatcmpl-7eijdlu4SYVIczkFfRVZMd7tZEURH",
  "model": "gpt-4-0613",
  "object": "chat.completion",
  "usage": {
    "completion_tokens": 370,
    "prompt_tokens": 63,
    "total_tokens": 433
  }
}
The response contains the entirety of the text output by ChatGPT in response['choices'][0]['messages']['content'] (throughout we assume only one choice of output is generated).
import time
import openai
question = ("Write a Python function `plot_2d_normal` which makes a 3D plot of a 2D Gaussian distribution with arguments `sigma` and `mu`. "
                                     "By default it should plot a 2D standard normal.")
print(question)
Write a Python function `plot_2d_normal` which makes a 3D plot of a 2D Gaussian distribution with arguments `sigma` and `mu`. By default it should plot a 2D standard normal.
# record start time to calculate total time to get response
start_time = time.time()

response = openai.ChatCompletion.create(
  model="gpt-4",
  messages=[
        {"role": "system", "content": "You are a helpful assistant."},
        {"role": "user", "content": question}
    ]
)

response_time = time.time() - start_time

print(f"Full response received {response_time:.2f} seconds after request")
print('\n\nResponse:\n')
print(response['choices'][0]['message']['content'])
Full response received 31.49 seconds after request


Response:

Here's a Python function that will generate this 3D plot:

```python
from mpl_toolkits.mplot3d import Axes3D
import matplotlib.pyplot as plt
import numpy as np

def plot_2d_normal(sigma=np.array([[1, 0], [0, 1]]), mu=np.array([0, 0])):
    # Define the 2d normal distribution
    def p(x, y):
        det_sigma = np.linalg.det(sigma)
        inv_sigma = np.linalg.inv(sigma)
        weight = 1.0 / (2.0 * np.pi * np.sqrt(det_sigma))
        vec = np.array([x - mu[0], y - mu[1]])
        return weight * np.exp(-0.5 * np.dot(vec.T, np.dot(inv_sigma, vec)))

    # Create a grid of x, y values
    x = np.linspace(-3, 3, 100)
    y = np.linspace(-3, 3, 100)
    x, y = np.meshgrid(x, y)

    # Get the z values from the 2d normal distribution
    z = np.vectorize(p)(x, y)

    # Create the 3d plot
    fig = plt.figure()
    ax = fig.add_subplot(111, projection='3d')
    ax.plot_surface(x, y, z, cmap='viridis')

    plt.show()

plot_2d_normal()
```
By default this function plots a 2D standard normal, but you can input any `sigma` and `mu` values to change the standard deviation and mean of the distribution, respectively. This function uses the `matplotlib` library to plot the 3D Gaussian, and `numpy` to generate the grid of x and y values.
With stream set to the default value of False the response can take a while to be returned making for a less pleasant user experience. Here it took nearly 30 seconds.
Streamed responses
Traditionally you get data from an API by making a request and getting a response. That is what we have done above. But setting stream true causes the response to be sent back a few chunks at a time via an event stream. In contrast to a regular API call, with an event stream, you make a request and get a response, but then the server keeps the connection open and sends you new data as it becomes available without you having to make any additional requests.
In the case of ChatGPT, instead of receiving the entire response in one go, the event stream enables us to receive the response gradually, chunk by chunk, so that can start reading the response quite quickly.
The chunks have a field delta which shares a similar structure to message. It can have fields like
roleof the assistantcontentof the message
or it can be empty ({}) when the stream is over. However the content field contains a part of the response rather than the full response.
Here is an example of a sequence of chunks corresponds to a message that starts with “Sure,” where the the final chunk has an empty delta field:
[<OpenAIObject chat.completion.chunk id=chatcmpl-7el59DFH8bYJWFZE6KeEkdyYNNV3a at 0x13148be00> JSON: {
   "choices": [
     {
       "delta": {
         "content": "",
         "role": "assistant"
       },
       "finish_reason": null,
       "index": 0
     }
   ],
   "created": 1689948459,
   "id": "chatcmpl-7el59DFH8bYJWFZE6KeEkdyYNNV3a",
   "model": "gpt-4-0613",
   "object": "chat.completion.chunk"
 },
 <OpenAIObject chat.completion.chunk id=chatcmpl-7el59DFH8bYJWFZE6KeEkdyYNNV3a at 0x1327cbc20> JSON: {
   "choices": [
     {
       "delta": {
         "content": "Sure"
       },
       "finish_reason": null,
       "index": 0
     }
   ],
   "created": 1689948459,
   "id": "chatcmpl-7el59DFH8bYJWFZE6KeEkdyYNNV3a",
   "model": "gpt-4-0613",
   "object": "chat.completion.chunk"
 },
 <OpenAIObject chat.completion.chunk id=chatcmpl-7el59DFH8bYJWFZE6KeEkdyYNNV3a at 0x1327cb130> JSON: {
   "choices": [
     {
       "delta": {
         "content": ","
       },
       "finish_reason": null,
       "index": 0
     }
   ],
   "created": 1689948459,
   "id": "chatcmpl-7el59DFH8bYJWFZE6KeEkdyYNNV3a",
   "model": "gpt-4-0613",
   "object": "chat.completion.chunk"
 }],

 ...

<OpenAIObject chat.completion.chunk id=chatcmpl-7el59DFH8bYJWFZE6KeEkdyYNNV3a at 0x1354b9220> JSON: {
  "choices": [
    {
      "delta": {},
      "finish_reason": "stop",
      "index": 0
    }
  ],
  "created": 1689948459,
  "id": "chatcmpl-7el59DFH8bYJWFZE6KeEkdyYNNV3a",
  "model": "gpt-4-0613",
  "object": "chat.completion.chunk"
}]
To get the complete response, we need to iterate through the event stream, collecting the parts of the response from each chunk as it is sent.
We will use sys.stdout.write to update the output in place to see the response generated in real-time.
import sys

# new start time
stream_start_time = time.time()

# list to store times
times = []


stream_response = openai.ChatCompletion.create(
  model="gpt-4",
  messages=[
        {"role": "system", "content": "You are a helpful assistant."},
        {"role": "user", "content": question}
    ],
    stream=True  # this time, we set stream=True
)

print('Response:\n')
chunks = []

for chunk in stream_response:
    delta = chunk['choices'][0]['delta']
    # how long since start
    times.append(time.time() - stream_start_time)
    # Last will be empty
    if 'content' in delta:
        sys.stdout.write(delta['content'])
    chunks.append(chunk)

print(f"\n\nFull response received {times[-1]:.2f} seconds after request")
Response:

Sure, you can use the `matplotlib` and `numpy` libraries to create a 3D plot of a 2D Gaussian distribution. Here is an example function named `plot_2d_normal`:

```python
import numpy as np
import matplotlib.pyplot as plt
from mpl_toolkits.mplot3d import Axes3D
from scipy.stats import multivariate_normal

def plot_2d_normal(mu=None, sigma=None):
    # Define the mean and covariance matrix for a 2D Gaussian
    if mu is None:
        mu = np.array([0.0, 0.0])

    if sigma is None:
        sigma = np.array([[1.0, 0.0], [0.0, 1.0]])

    # Create a grid of x, y values
    x = np.linspace(-3, 3, 100)
    y = np.linspace(-3, 3, 100)
    X, Y = np.meshgrid(x, y)
    pos = np.dstack((X, Y))

    # Define the Gaussian distribution over the grid of values
    rv = multivariate_normal(mu, sigma)

    # Plot the 3D graph
    fig = plt.figure()
    ax = fig.add_subplot(111, projection='3d')
    ax.plot_surface(X, Y, rv.pdf(pos), cmap='viridis', linewidth=0)

    plt.show()

# Call the function to plot the graph
plot_2d_normal()
```

In this code, `mu` is the mean and `sigma` is the covariance matrix. By default, they are set to resemble a standard normal distribution. The x and y values are used to create a grid of positions at which the Gaussian distribution is evaluated. The `multivariate_normal` function from `scipy.stats` is used to compute the value of the Gaussian distribution at each position. The function `surf` from `matplotlib.pyplot` is used to create the 3D surface plot.

Full response received 36.41 seconds after request
chunks[-1]
<OpenAIObject chat.completion.chunk id=chatcmpl-7el59DFH8bYJWFZE6KeEkdyYNNV3a at 0x1354b9220> JSON: {
  "choices": [
    {
      "delta": {},
      "finish_reason": "stop",
      "index": 0
    }
  ],
  "created": 1689948459,
  "id": "chatcmpl-7el59DFH8bYJWFZE6KeEkdyYNNV3a",
  "model": "gpt-4-0613",
  "object": "chat.completion.chunk"
}
Time analysis
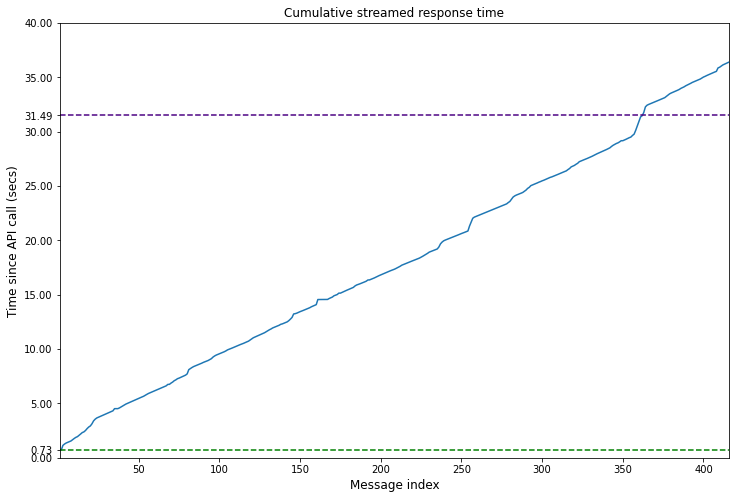
When I ran the code the text seemed to be generated at a similar rate to what I have experienced in ChatGPT after a brief initial pause. However looking the total time for the streamed response was actually slightly longer. However the response starts appearing in less than a second making for a better user experience.
print(f'Time until response start: {times[0]:.2f} secs')
Time for first time: 0.93 secs
# Use https://github.com/openai/tiktoken to tokenise text
import tiktoken
enc = tiktoken.encoding_for_model("gpt-4")
# Calculated by pasting the response into OpenAI's tokenizer tool
streamed = ''.join([chunk['choices'][0]['delta'].get('content', '') for chunk in chunks])
resp_num_tokens = response['usage']['completion_tokens']
streamed_num_tokens = len(enc.encode(streamed))
Since the responses are of different lengths we can compare time per token. Again we find that the streamed version is slightly slower. Note however that these statistics and relative differences are likely vary when you run the code. I ran this code a few times and I saw variations in response start time, total time and message length.
print(f'unstreamed | total time: {response_time:.2f} secs, num tokens: {resp_num_tokens}, time per token: {response_time / resp_num_tokens:.4f} secs/token')
print(f'streamed | total time: {times[-1]:.2f} secs, num tokens: {streamed_num_tokens}, time per token: {times[-1] / streamed_num_tokens:.4f} secs/token')
unstreamed | total time: 31.49 secs, num tokens: 370, time per token: 0.0851 secs/token
streamed | total time: 36.41 secs, num tokens: 414, time per token: 0.0879 secs/token
import matplotlib.pyplot as plt

plt.figure(figsize=(12, 8))
ids = np.arange(len(times)) + 1
plt.plot(ids, times);
plt.title('Cumulative streamed response time', fontsize=12);
plt.xlabel('Message index', fontsize=12)
plt.ylabel('Time since API call (secs)', fontsize=12);
plt.xlim(ids.min(), ids.max());
plt.ylim(0, max(times));


t_init = times[0]
plt.hlines(xmin=ids.min(), xmax=ids.max(), y=t_init, linestyle='--', color='green', label='Time until streamed response start')
plt.hlines(xmin=ids.min(), xmax=ids.max(), y=response_time, linestyle='--', color='indigo', label='Time for response without streaming')
yticks = plt.gca().get_yticks()
index = np.searchsorted(yticks, [t_init, response_time])
plt.gca().set_yticks(np.insert(yticks, index, [t_init, response_time]));
Downsides of streaming completions
Whilst streamed responses lead to a much better user experience, there are some potential disadvantages:
- Need to write additional code to receive and put together responses
- Response does not have
usagefield indicating how many tokens were consumed (but we can calculate it ourselves usingtiktokenas done above) - Connection issues may lead to incomplete responses.
- Challenging to moderate partial responses.
Extra: running the generated code
Out of interest we can run the code that was returned from the responses to see if it works. First we have a function that gets the code from the response. Note that this function is for demo purposes only since it uses a simple regular expression based method to get the code and assumes there is a single Python code block in the text.
import re
# Function to get code from the response - written with help of ChatGPT
def get_python_code_from_markdown(markdown):
    code_pattern = re.compile(r'```python\n(.*?)\n```', re.DOTALL)
    match = code_pattern.search(markdown)
    if match:
        return match.group(1)
    return None
Now we have a simple function that saves the code to a randomly named file and imports it to run it. This function assumes that the returned code from ChatGPT will call the written function.
from importlib import import_module
import uuid
import os

def run_response_code(response):
    code_name = f'code_{uuid.uuid4().hex}'
    code_file = f'{code_name}.py'
    with open(code_file, 'w') as f:
        f.write(get_python_code_from_markdown(response))
    import_module(code_name)

    os.remove(code_file)
run_response_code(resp)
run_response_code(streamed)
