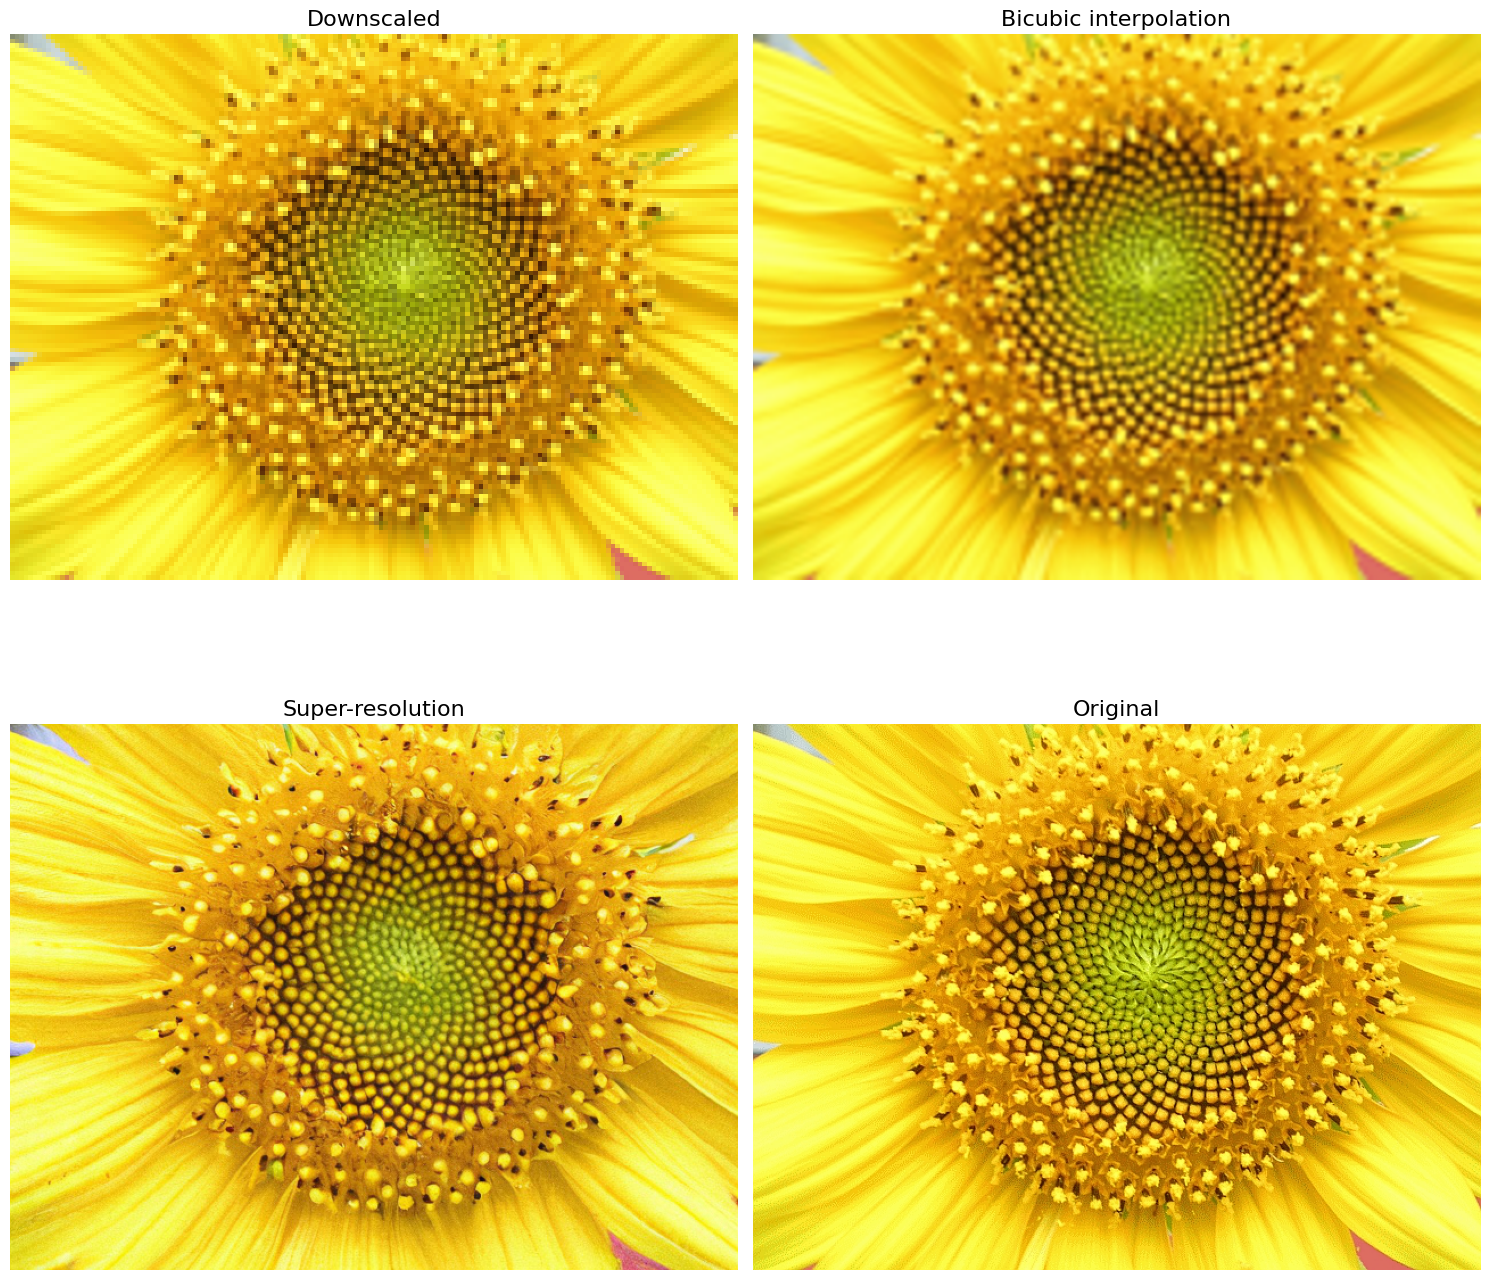
A quick introduction to super-resolution using Stable Diffusion and the Diffusers library
In this blog post, we will show how to use the diffusers library to upscale images using the Stable Diffusion Upscaler model. The model is a diffusion-based super-resolution model that is capable of generating high-quality upscaled images.
How to create matrices in LaTeX
This blog post will guide you through the steps of creating matrices in LaTeX. It will start with the general syntax and then explain how to create row and column vectors, determinants, arbitrary sized matrices and nested matrices. It will conclude with several examples of real world matrices and the use of matrices in mathematical expressions.

How to Create Quantum Gate Diagrams in Python
A key concept in quantum computing is the quantum logic gate. Quantum gates are the building blocks of quantum circuits. In this blog we will learn how to create quantum gate and quantum circuit diagrams in Python using the SymPy library.

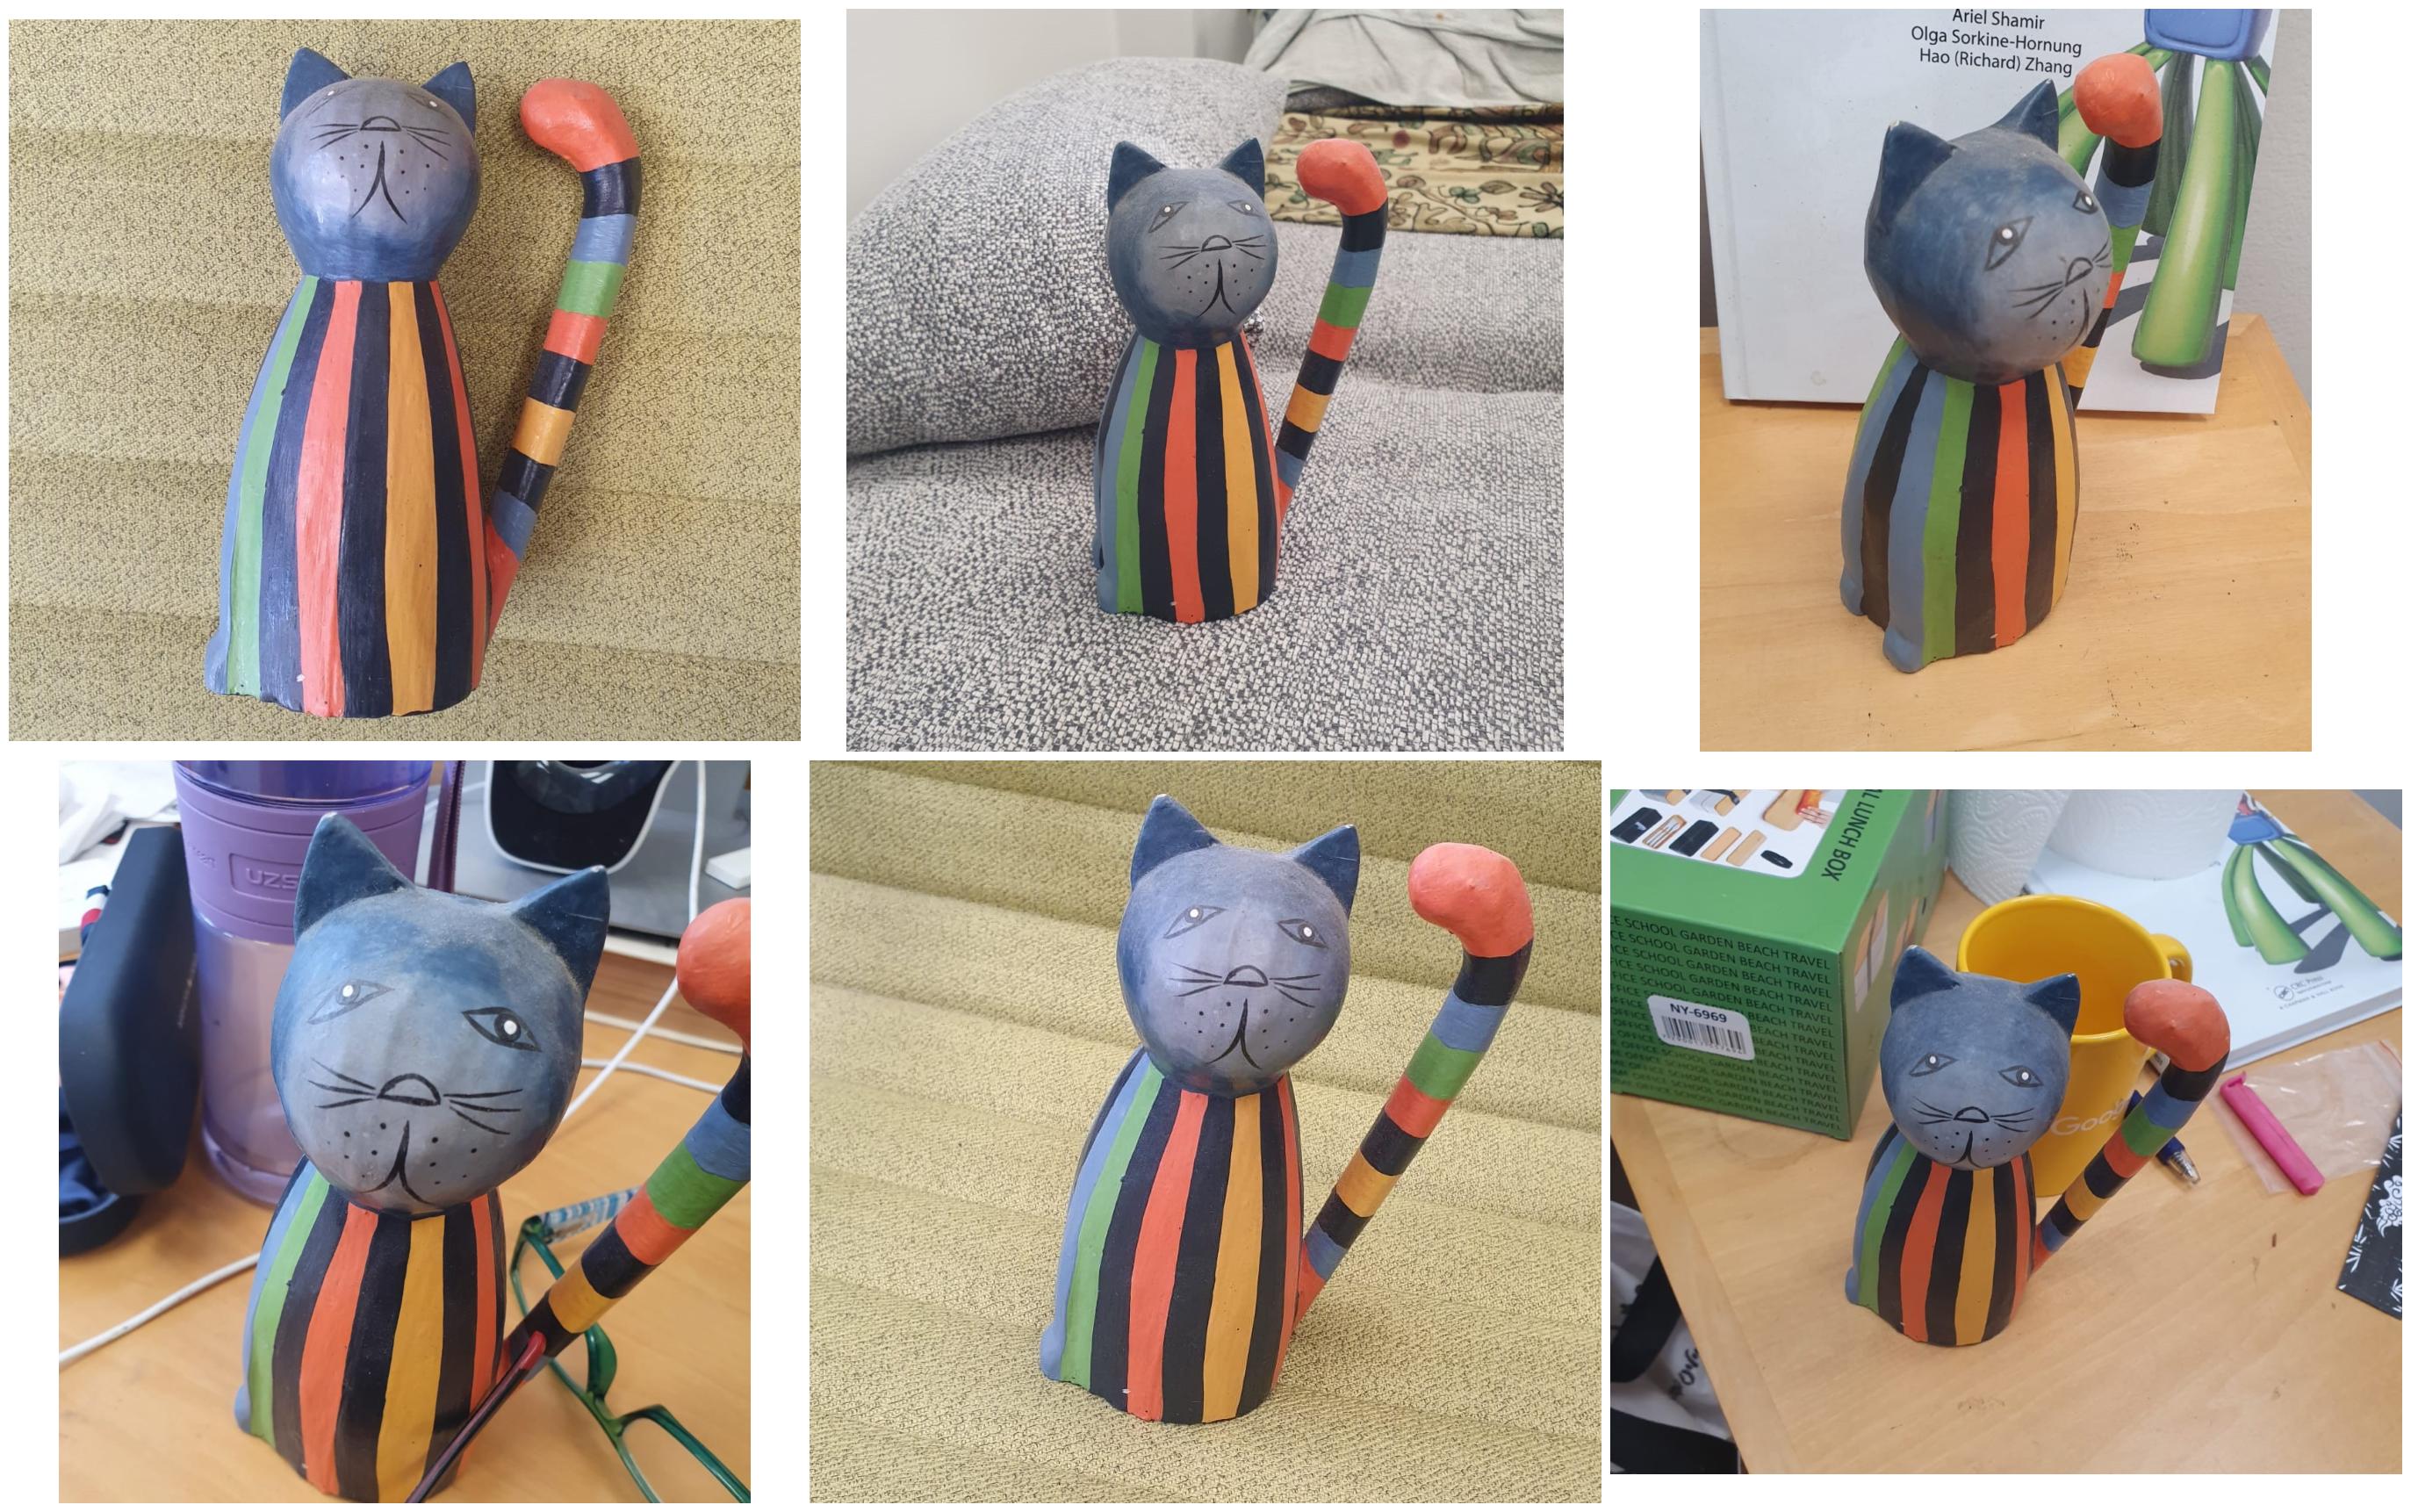
How I ran the Hugging Face Diffusers Textual Inversion example on an AWS EC2 Instance
This blog extends the Hugging Face Diffusers Textual Inversion tutorial by outlining the steps I took to set up an AWS EC2 instance, install libraries and run the example.
A Minimalist ChatGPT for Jupyter Notebook or Command Line
In this blog post, we will explore how to implement a minimalist ChatGPT-style app in a Jupyter Notebook. The goal is to provide an understanding of the important concepts, components, and techniques required to create a chat app on top of a large language model (LLM), specifically OpenAI’s GPT.

Policy Iteration for finite MDPs
In this blogpost we will implement Example 4.2 from Chapter 4 Reinforcement Learning (Sutton and Barto aka the RL book). This is an example of a problem involving a finite Markov Decision Process for which policy iteration is used to find an optimal policy.
How to use curly brackets {} in LaTeX
In this tutorial, we will discuss various ways to use curly brackets $\{\}$ in LaTeX. The simplest case involves using curly brackets to denote a set. However, curly brackets, or braces, can also be used to group multiple lines of calculations and mathematical equations or to add explanatory text above or below the expressions.

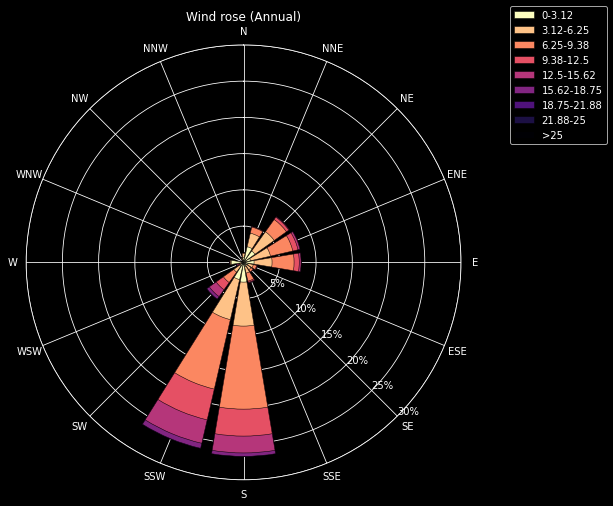
How to plot a Windrose in Python
A windrose is a circular histogram that shows the distribution of wind speeds and directions over a period of time. In this tutorial we will learn how to plot a windrose in Python using Matplotlib and Plotly.
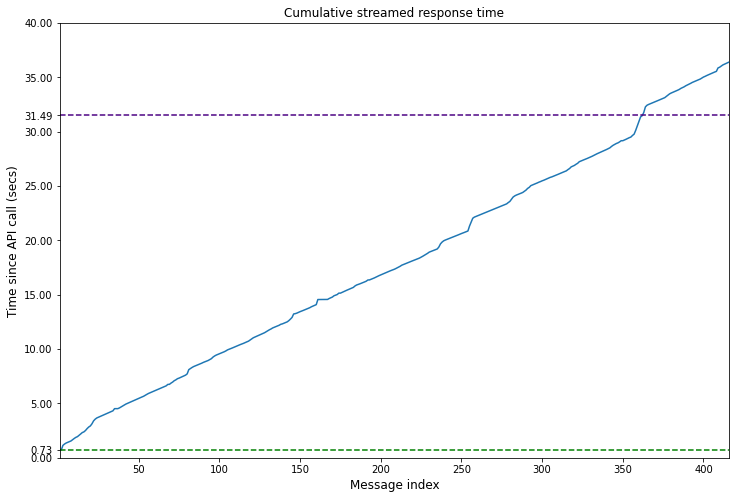
How to stream ChatGPT responses from the OpenAI API
In this blog post we will learn how you can replicate this experience of the ChatGPT web application by streaming responses from the OpenAI API.
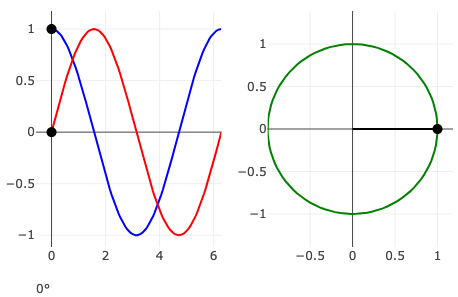
Animations in Plotly.js
In this blog, we will demystify the process of creating interactive animations using Plotly.js.